MedITEX Key Performance Indicators manual
From MedITEX - Wiki
| Line 1: | Line 1: | ||
<p><img style="display: block; margin-left: auto; margin-right: auto;" src="/images/MainShort.png" alt="" width="795" height="342" /></p> | <p><img style="display: block; margin-left: auto; margin-right: auto;" src="/images/MainShort.png" alt="" width="795" height="342" /></p> | ||
| − | < | + | <p> </p> |
| + | <p><span id="result_box" lang="en"><span class="hps">MedITEX</span> <span class="hps">KPI</span> (<strong>Key Performance Indicators</strong>) <span class="hps">is an important feature provided by MedITEX tools. It <strong>centralizes information and generates reports</strong> in a very easy manner.</span></span></p> | ||
| + | <p><span id="result_box" lang="en"><span class="hps">KPI allows</span> <span class="hps">the <strong>early detection of</strong></span><strong><span class="hps"> trends</span> and</strong><span class="hps"><strong> vulnerabilities</strong>,</span> so it is possible to identify potential problems and implement related improvements. </span><span id="result_box" lang="en"><span class="hps">It</span><span class="hps"> </span> runs <strong>silently on <span class="hps">the background</span> <span class="hps">of the system</span> and <span class="hps">integrates</span> </strong><span class="hps atn"><strong>different data sources</strong> (</span><span>Lab, Cryo</span><span>,</span> <span class="hps">management</span><span>, etc.) in order to</span><strong><span class="hps"> evaluate them</span> <span class="hps">at a central location</span> <span class="hps">in real time</span></strong><span>.</span></span><span id="result_box" lang="en"> Once evaluated, it <strong>displays c<span class="hps">lear</span> </strong><span class="hps"><strong>graphs</strong> and <strong>ratings </strong></span><strong>for the requested information</strong>, showing <span class="hps"> </span><span class="hps">where action is needed to better improve the quality of service</span><span>.</span></span></p> | ||
| + | <p>This funcionality is accessable at the menu bar.</p> | ||
| + | <p>Go to <strong>Reports -> MedITEX Key Performance Indicators</strong>.</p> | ||
| + | <table style="margin-left: auto; margin-right: auto;" border="0"> | ||
| + | <tbody> | ||
| + | <tr> | ||
| + | <td><img src="/images/KPIRed.png" alt="" width="589" height="303" /></td> | ||
| + | </tr> | ||
| + | </tbody> | ||
| + | </table> | ||
| + | <p> </p> | ||
| + | <h2>Interface</h2> | ||
| + | <p><strong>MedITEX KPI has a very simple and straight forward interface</strong>. We will divide this interface into smaller sections that have specific functionalities.</p> | ||
| + | <p><em>Hint: click on images throughout pages to enlarge them.</em></p> | ||
| + | <table style="margin-left: auto; margin-right: auto;" border="0"> | ||
| + | <tbody> | ||
| + | <tr> | ||
| + | <td style="text-align: center;">[[Image:MainKPIRed.png|none|740px|thumb|left|link=http://wiki.meditex-software.com/images/MainKPIRed.png| ]]</td> | ||
| + | </tr> | ||
| + | </tbody> | ||
| + | </table> | ||
| + | <p> </p> | ||
| + | <h3>1. Navigation</h3> | ||
| + | <table style="margin-left: auto; margin-right: auto;" border="0"> | ||
| + | <tbody> | ||
| + | <tr> | ||
| + | <td><img src="/images/Nav.png" alt="" width="303" height="97" /></td> | ||
| + | </tr> | ||
| + | </tbody> | ||
| + | </table> | ||
| + | <p><span id="result_box" lang="en"><span class="hps"> </span></span></p> | ||
<ul> | <ul> | ||
| − | <li><span | + | <li><span id="result_box" lang="en"><span class="hps">In the navigation pane</span> <span class="hps">you can</span> <span class="hps">choose</span> <span class="hps">between the different</span> <span class="hps">data sources</span><span>.</span></span></li> |
</ul> | </ul> | ||
| + | <ul> | ||
| + | <li>You can select individual transactions / events to have to evaluate this.</li> | ||
| + | </ul> | ||
| + | <table style="margin-left: auto; margin-right: auto;" border="0" width="606" height="154"> | ||
| + | <tbody> | ||
| + | <tr> | ||
| + | <td><img src="/images/ShowButtonsRed.png" alt="" width="445" height="137" /></td> | ||
| + | <td>Clicking on the arrow at the bottom of the navigation, you can change the number of data sources being displayed.</td> | ||
| + | </tr> | ||
| + | </tbody> | ||
| + | </table> | ||
| + | <p> </p> | ||
| + | <h3>2. Filtering and grouping</h3> | ||
| + | <p>Use this area to set filters groups for the data retrieved.</p> | ||
| + | <p><strong>Available filters are:</strong></p> | ||
| + | <ul> | ||
| + | <li>Reference date</li> | ||
| + | </ul> | ||
| + | <ul> | ||
| + | <li>Time period</li> | ||
| + | </ul> | ||
| + | <ul> | ||
| + | <li>Treatments</li> | ||
| + | </ul> | ||
| + | <ul> | ||
| + | <li>Treatment type</li> | ||
| + | </ul> | ||
| + | <ul> | ||
| + | <li>Age groups</li> | ||
| + | </ul> | ||
| + | <table style="margin-left: auto; margin-right: auto;" border="0"> | ||
| + | <tbody> | ||
| + | <tr> | ||
| + | <td><img src="/images/FilterKPI.png" alt="" width="382" height="181" /></td> | ||
| + | </tr> | ||
| + | </tbody> | ||
| + | </table> | ||
| + | <p> </p> | ||
| + | <p>Age groups can be created/edited clicking on the button at the end of the selection box.</p> | ||
| + | <table style="margin-left: auto; margin-right: auto;" border="0"> | ||
| + | <tbody> | ||
| + | <tr> | ||
| + | <td><img src="/images/AgeGroupsKPI.png" alt="" width="376" height="433" /></td> | ||
| + | </tr> | ||
| + | </tbody> | ||
| + | </table> | ||
| + | <p> </p> | ||
| + | <p>Here, you add/delete age groups by clicking on the <strong>"+"</strong> and <strong>"x" </strong>buttons. To edit information, simply click on the cell to change information. The colour can be changed by double-clicking on it.</p> | ||
| + | <p> </p> | ||
| + | <hr /> | ||
| + | <p> </p> | ||
| + | <p><strong>Available groups are:</strong></p> | ||
| + | <ul> | ||
| + | <li>Time period</li> | ||
| + | </ul> | ||
| + | <ul> | ||
| + | <li>Staff</li> | ||
| + | </ul> | ||
| + | <ul> | ||
| + | <li>Treatments</li> | ||
| + | </ul> | ||
| + | <ul> | ||
| + | <li>Age groups</li> | ||
| + | </ul> | ||
| + | <table style="margin-left: auto; margin-right: auto;" border="0" width="360" height="178"> | ||
| + | <tbody> | ||
| + | <tr> | ||
| + | <td><img src="/images/Grouping.png" alt="" width="385" height="185" /></td> | ||
| + | </tr> | ||
| + | </tbody> | ||
| + | </table> | ||
| + | <p> </p> | ||
| + | <h3>3. Results</h3> | ||
| + | <p><span id="result_box" class="short_text" lang="en"><span class="hps">This area in MedITEX KPI <strong>displays charts and tables</strong> created from data provided by IVF.</span><span class="hps"> </span><span> </span></span></p> | ||
| + | <table style="margin-left: auto; margin-right: auto;" border="0"> | ||
| + | <tbody> | ||
| + | <tr> | ||
| + | <td>[[Image:ResultsKPI.png|none|740px|thumb|left|link=http://wiki.meditex-software.com/images/ResultsKPI.png| ]]</td> | ||
| + | </tr> | ||
| + | </tbody> | ||
| + | </table> | ||
| + | <p style="text-align: left;"> </p> | ||
| + | <p style="text-align: left;"><strong><span class="short_text" lang="en">The tool bar has the folowing functionalities:</span></strong></p> | ||
| + | <ul> | ||
| + | <li><span class="short_text" lang="en"><span><strong>GO!:</strong> it starts the query and displays the information.<br /></span></span></li> | ||
| + | <li><span class="short_text" lang="en"><span><strong>Sum:</strong> changes between absolute and percentage values.<br /></span></span></li> | ||
| + | <li><span class="short_text" lang="en"><span><strong>Legend: </strong>hide/show legend.<br /></span></span></li> | ||
| + | <li><span class="short_text" lang="en"><span><strong>Labels:</strong> hide/show labels on top of bars on the chart.<br /></span></span></li> | ||
| + | <li><span class="short_text" lang="en"><span><strong>By years:</strong> if the filter "Time period" is selected, it is possible to change the chart view by year. Click <a href="/images/ByYearsKPI.png">here</a> for an example.<br /></span></span></li> | ||
| + | <li><span class="short_text" lang="en"><span><strong>Invert: </strong>inverts the axis of the chart and table.<br /></span></span></li> | ||
| + | <li><span class="short_text" lang="en"><span><strong>Rotate text:</strong> rotates text under the bars by 90 degrees <br /></span></span></li> | ||
| + | <li><span class="short_text" lang="en"><span><strong>Target value:</strong> hide/show target value. It creates a line on the chart with the value inserted.<br /></span></span></li> | ||
| + | <li><span class="short_text" lang="en"><span><strong>Export:</strong> exports the chart to bitmap or copy it to the clipboard. When on Table view, it is also possible to export it to Microft Excel.<br /></span></span></li> | ||
| + | <li><span class="short_text" lang="en"><span><strong>Print: </strong>opens Print Preview for printing the chart or table.<br /></span></span></li> | ||
| + | </ul> | ||
| + | <p><span class="mw-headline"><br /></span></p> | ||
<p> </p> | <p> </p> | ||
<h2><span id="How_to..." class="mw-headline">How to...</span></h2> | <h2><span id="How_to..." class="mw-headline">How to...</span></h2> | ||
Revision as of 10:48, 9 January 2013
<img style="display: block; margin-left: auto; margin-right: auto;" src="/images/MainShort.png" alt="" width="795" height="342" />
MedITEX KPI (Key Performance Indicators) is an important feature provided by MedITEX tools. It centralizes information and generates reports in a very easy manner.
KPI allows the early detection of trends and vulnerabilities, so it is possible to identify potential problems and implement related improvements. It runs silently on the background of the system and integrates different data sources (Lab, Cryo, management, etc.) in order to evaluate them at a central location in real time. Once evaluated, it displays clear graphs and ratings for the requested information, showing where action is needed to better improve the quality of service.
This funcionality is accessable at the menu bar.
Go to Reports -> MedITEX Key Performance Indicators.
| <img src="/images/KPIRed.png" alt="" width="589" height="303" /> |
Contents |
Interface
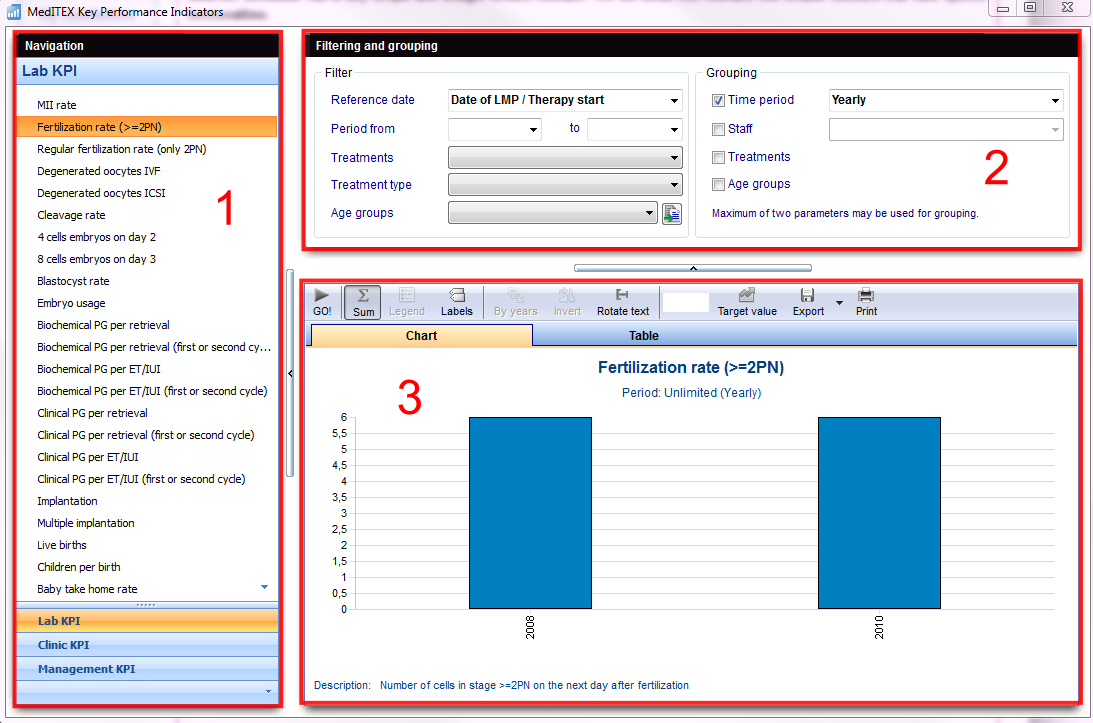
MedITEX KPI has a very simple and straight forward interface. We will divide this interface into smaller sections that have specific functionalities.
Hint: click on images throughout pages to enlarge them.
 |
| <img src="/images/Nav.png" alt="" width="303" height="97" /> |
- In the navigation pane you can choose between the different data sources.
- You can select individual transactions / events to have to evaluate this.
| <img src="/images/ShowButtonsRed.png" alt="" width="445" height="137" /> | Clicking on the arrow at the bottom of the navigation, you can change the number of data sources being displayed. |
2. Filtering and grouping
Use this area to set filters groups for the data retrieved.
Available filters are:
- Reference date
- Time period
- Treatments
- Treatment type
- Age groups
| <img src="/images/FilterKPI.png" alt="" width="382" height="181" /> |
Age groups can be created/edited clicking on the button at the end of the selection box.
| <img src="/images/AgeGroupsKPI.png" alt="" width="376" height="433" /> |
Here, you add/delete age groups by clicking on the "+" and "x" buttons. To edit information, simply click on the cell to change information. The colour can be changed by double-clicking on it.
Available groups are:
- Time period
- Staff
- Treatments
- Age groups
| <img src="/images/Grouping.png" alt="" width="385" height="185" /> |
3. Results
This area in MedITEX KPI displays charts and tables created from data provided by IVF.
 |
The tool bar has the folowing functionalities:
- GO!: it starts the query and displays the information.
- Sum: changes between absolute and percentage values.
- Legend: hide/show legend.
- Labels: hide/show labels on top of bars on the chart.
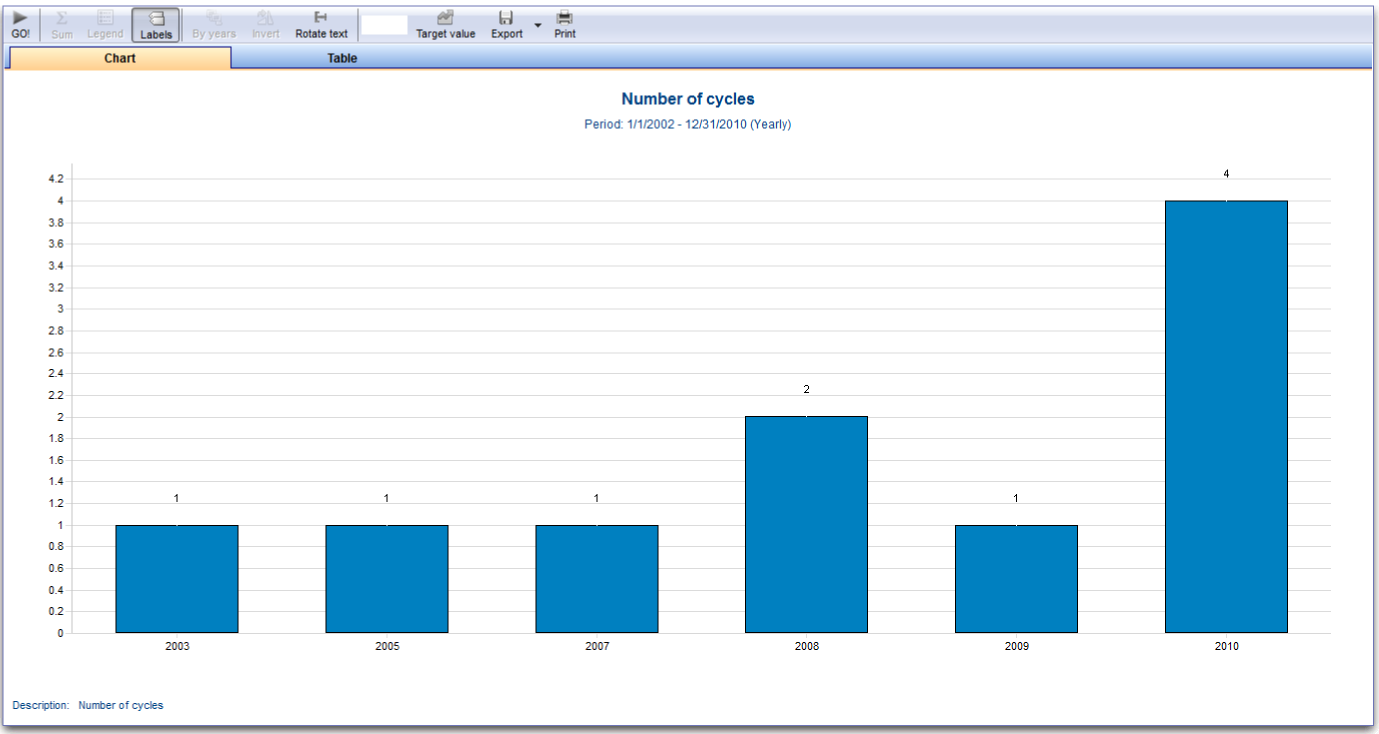
- By years: if the filter "Time period" is selected, it is possible to change the chart view by year. Click <a href="/images/ByYearsKPI.png">here</a> for an example.
- Invert: inverts the axis of the chart and table.
- Rotate text: rotates text under the bars by 90 degrees
- Target value: hide/show target value. It creates a line on the chart with the value inserted.
- Export: exports the chart to bitmap or copy it to the clipboard. When on Table view, it is also possible to export it to Microft Excel.
- Print: opens Print Preview for printing the chart or table.
How to...
| <a href="/index.php?title=MedITEX_KPI_how_to"><img style="vertical-align: middle;" src="/images/MedITEX_KPI_129x129.png" alt="" width="60" height="60" /></a> <a href="/index.php?title=MedITEX_KPI_how_to">MedITEX KPI</a> |
| <a href="/index.php?title=Main_Page">Back to MedITEX products</a> | <a href="#top">Back to top</a> |