Statistics
From MedITEX - Wiki
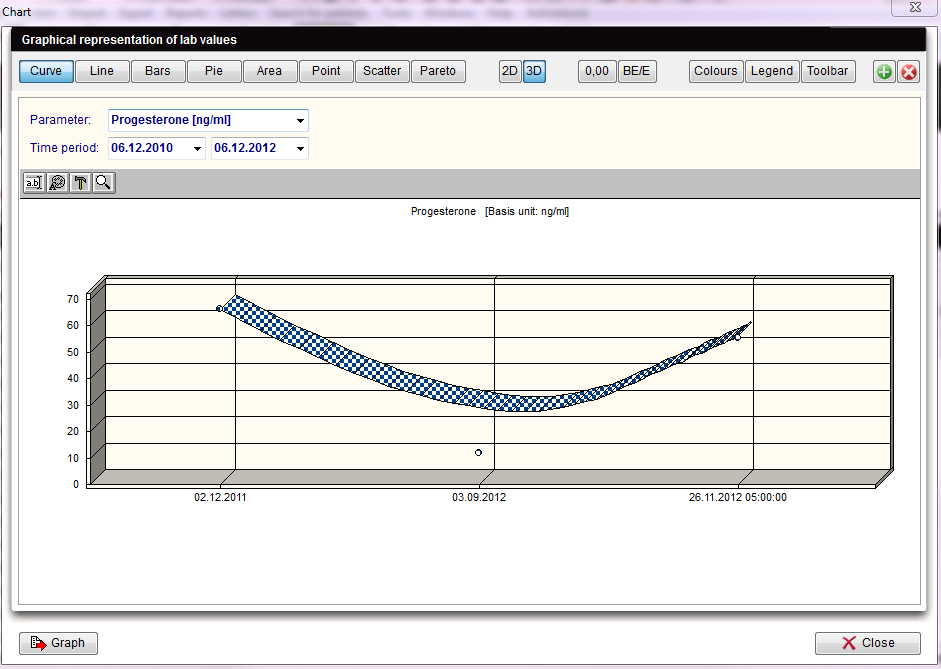
| If the "Statistics" - button is clicked the following window will pop up: |
 |
For the x-axis of your statistics you can use all columns of the list of results.
For the y-axis you can only use column whose associated field from the data base contains numerical values only (integers, floating-point numbers).
These are only descriptive statistics: histograms, plots and their individual parts.
The interpretation of the y-values exclusively depends on the scale measurement of the data used (the data is, however, displayed in such a way as if the values were all interval-scaled).
| Explaination of the fields/icons: | |
| Curve, Bars... Pareto | These are different layouts that can be chosen for the chart. |
| By clickng on these icon the chart will have a 2D/3D layout. | |
 |
By clickng on these icon can be set the decimal places. |
| Choose if you want to see the basis unit or the unit. |
|
| Here can be chosen the background colours of the graph and of the form. A third option allow to swap the colours between the graph and the form. | |
| Click on this button to show/hide the legend. | |
| Click on this button to show/hide the toolbar. | |
| Create a new chart. It will be opend at the right side of the window. Close it with the "X". | |
| Parameter | Change the Parameter who is shown in the chart. |
| Time period | Set a date. |
 |
Click on this icon to edit chat's titles. |
| Click on this icon to edit font and colour of titles and legend. | |
| Click on this icon to hide/show pattern bar, palette bar and legend. By clicking on this icon it is also possible to access to the data editor. | |
| Click on this icon to modify the view options. | |
|
By clicking this button the user can:
|
|
| Back to the MedITEX IVF menu | Back to top |