Lab diagnostics female
From MedITEX - Wiki
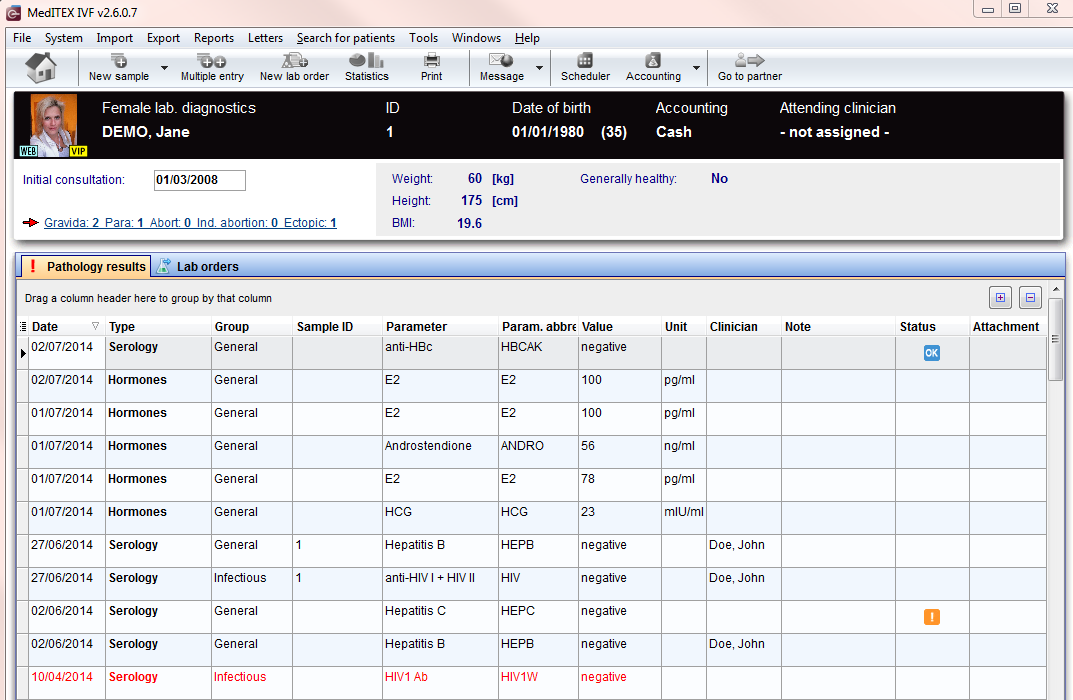 |
The Lab diagnostics page is divided in two main parts:
- The upper contains a summary of previous pregnancies (only for the female patient) and some anthropometric data.
- The lower section contains a list of all Lab exames performed and, for the male patient, a section containing a list of all the spermiogram performed.
Note: If the summary of previous pregnancies is clicked a window showing the outcome of the previous pregnancies will pop up.
Contents |
Buttons
| "Home" button: Click on this icon to go to the starting window. | |
| New sample: Click on this icon to document a new sample. | |
| Multiple entry: Click on this icon to document many new samples at a time. | |
 |
Lab order: |
| Statistics: Click on this icon to create a graphical representation of lab values. | |
| Print: Click on this icon to print the list of lab samples. | |
| New message: | |
| Go to partner: Click here to go to the partner's Lab diagnostics. | |
|
With these two buttons you can decide how much rows you see in the list. (Expand all rows, Collapse all rows) |
Clickable areas
Some clickable areas have special functionalities. Click on it to have more information.
| Here you can add the date of initial consultation. | |
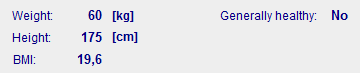 |
It is no clickable area. You can see informations about the physique of the patient. |
| Previous pregnancies: Click on this link to open a window showing more info related to previous pregnancies' outcome. |
Creating a spermiogram
If the arrow at the right of the "New sample" icon is clicked when the male patient is selected, one more option it is available: spermiogram.
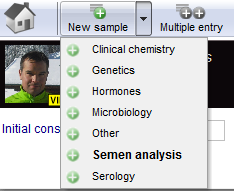
Selecting spermiogram option will open the following window:
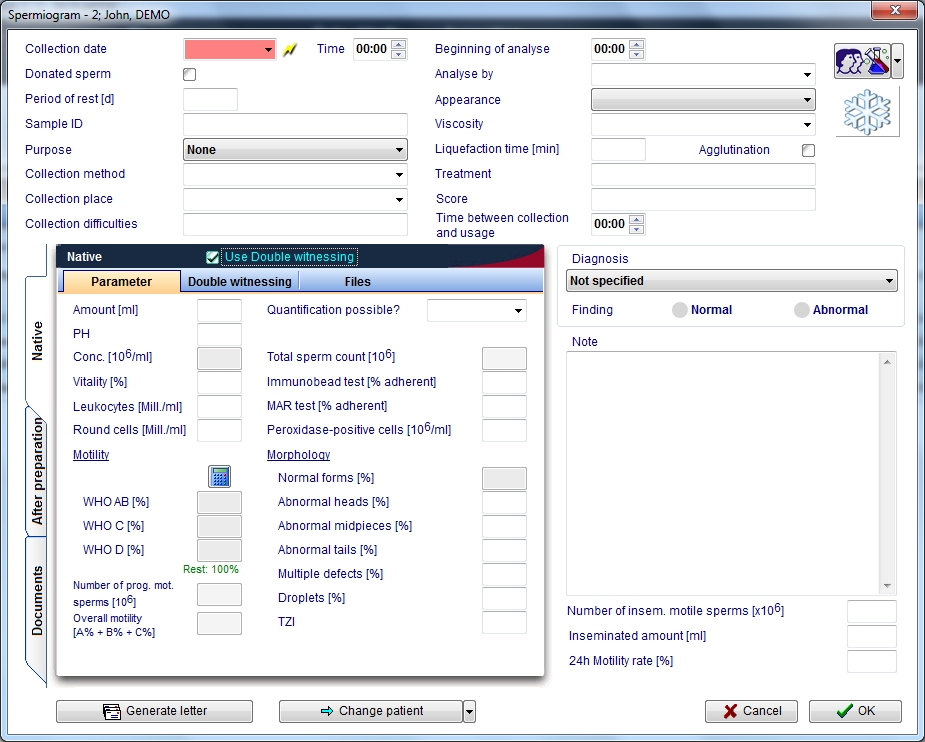 |
Click on this icon to access the QM field section related to this area or on the right arrow to block the QM fields or to see the change log | |||
 |
Click on this icon to put this sample in the cryostorage | |||
| |
Check this box to document the double witnessing according the "WHO laboratory manual for t he examination and processing of human semen - Fifth edition 2010" |
|||
| Click this icon to generate a spermiogram letter | ||||
| |
Click on this icon to go to another patient. If the black arrow on the right is clicked it is possible to choose to skip to the latest spermiogram or to generate a new spermiogram | |||
In this window it is possible to document general data about the semen sample and data before and after the preparation. The "After preparation" section differs from the "Native" section only for a label called "Preparation". In this label it is possible to document: preparation date and time, operator and up to four preparation methods. Thanks to the document section it is possible to attach a document to the spermiogram.
Calculating the motility
By clicking on the calculator icon ![]() a window opens. In this window shall be input the total number of sperms observed and the number of sperms observed for each of this category: imotile, locally motile, non linear motile, slow progressive motile and fast progressive motile. When the numbers are typed in, the calulator calculates automatically the WHO percentages for each WHO class. It is possible to group/ungroup the WHO A and WHO B in the system settings.
a window opens. In this window shall be input the total number of sperms observed and the number of sperms observed for each of this category: imotile, locally motile, non linear motile, slow progressive motile and fast progressive motile. When the numbers are typed in, the calulator calculates automatically the WHO percentages for each WHO class. It is possible to group/ungroup the WHO A and WHO B in the system settings.
Using the double witnessing
When the box "Use double witnessing" is checked the double witnessing tool is activated: the Double witnessing label is availabe in Native and After preparation section. The double witnessing is split in two more section: counting and results.
Note: when the double witnessing it is activated some of the fields in the parameter section will be blocked. This fields will be filled with the mean values derivating from the two observation of the double witnessing.
Counting
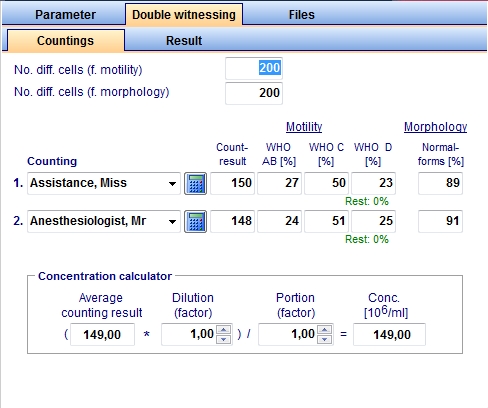
This section is used by operator 1 and operator 2 to input the total number of sperms observed (Count result) and number of sperms belonging to the WHO classes. It is also offered a sperm calculator. When the data are typed by the two operators, the average counting result and the concentration of spermatozoa in the sample will be automatically calculated depending on the dilution factor and on the portion (rows counted) of the haemocytometric chamber. Once performed the double counting, the results are shown in the result section.
Result
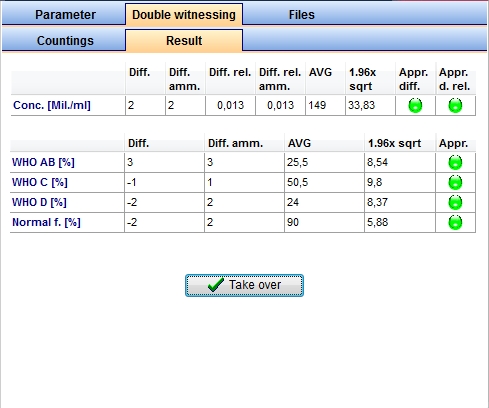
In this section it is shown if the differences between two replicate counts are acceptable according the "WHO laboratory manual for the Examination and processing of human semen – Ed V 2010". To confirm the observation made by the two operators just press the button take over. After the data has been taken over, it will not be possible to edit the double witnessing data anymore.
Meaning of the columns:
- Diff.= differentiation
- Diff. amm.= differentiation amount
- Diff. rel.= differentiation relative
- Diff. rel. amm. = differentiation relative amount
- AVG= arithmetic average
- 1.96x radq= 1.96x square root
- Appr. d. = approval differentiation
- Appr. d. rel.= approval differentiation relative
Creating graphical representation of lab values
If the Statistics button is clicked the following window will pop up:
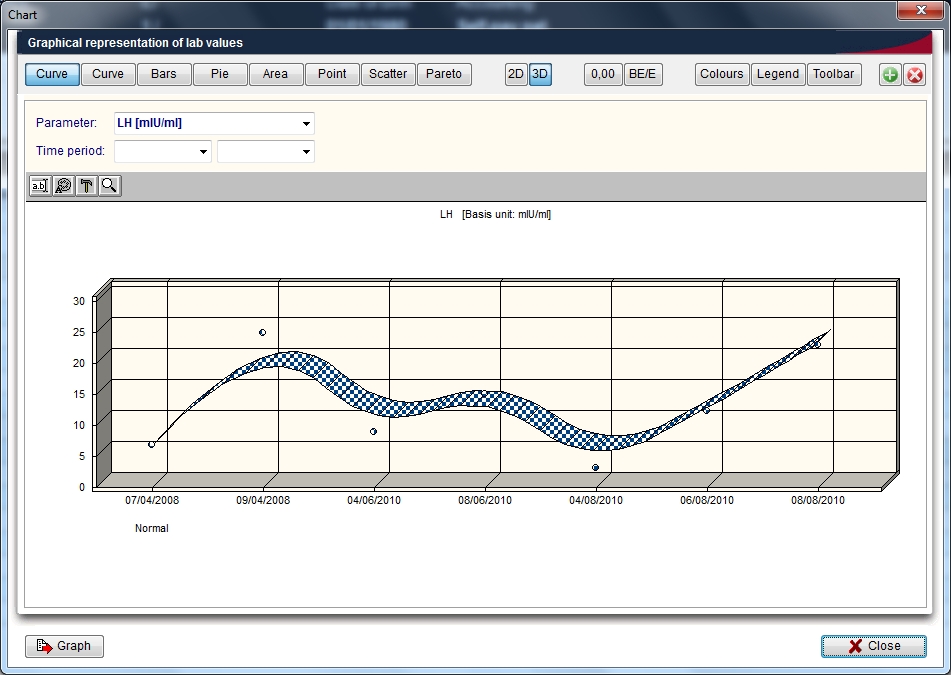
Explaination of the fields/icons:
- Curve, Bars... Pareto: these are different layouts that can be chosen for the chart
- 2D/3D: by clickng on these icon the chart will have a 2D/3D layout
- 0,00: by clickng on these icon can be set the decimal places
- BE/E: this icon allow to togle from Basis unit to Unit and vice versa
- Colours: here can be chosen the background colours of the graph and of the form. A third option allow to swap the colours between the graph and the form
- Legend: click on this button to show/hide the legend
- Toolbar: click on this button to show/hide the toolbar
- Parameter: here it is possible to choose the parameter used for the chart
- Time period: input in the first window the start date and in the second the final date of the period considered for the X axis of the chart
 : click on this icon to create up to two new charts
 : click on this icon to close charts
 : click on this icon to edit chat's titles
 : click on this icon to edit font and colour of titles and legend
 : click on this icon to hide/show pattern bar, palette bar and legend. By clicking on this icon it is also possible to access to the data editor.
 : click on this icon to modify the view options
- Graph: by clicking this button the user can:
- choose to print the chart,
- to send the data or the chart to the clipboard,
- to export the chart as .chf, .xls or .csv file,
- to import the chart from .chf files
- to exchange chart type