Statistics
From MedITEX - Wiki
| (8 intermediate revisions by 2 users not shown) | |||
| Line 3: | Line 3: | ||
<tr> | <tr> | ||
<td><img src="/images/Statistics.png" alt="" width="60" height="38" /></td> | <td><img src="/images/Statistics.png" alt="" width="60" height="38" /></td> | ||
| − | <td>If the <strong> | + | <td>If the <strong>Statistics button</strong> is clicked the following window will pop up:</td> |
</tr> | </tr> | ||
</tbody> | </tbody> | ||
</table> | </table> | ||
| − | <table border="0"> | + | <table style="margin-left: auto; margin-right: auto;" border="0"> |
<tbody> | <tbody> | ||
<tr> | <tr> | ||
| Line 23: | Line 23: | ||
<tbody> | <tbody> | ||
<tr> | <tr> | ||
| − | <td colspan="2"><strong> | + | <td colspan="2"><strong>Explanation of the fields/icons:</strong></td> |
</tr> | </tr> | ||
<tr> | <tr> | ||
<td>Curve, Bars... Pareto</td> | <td>Curve, Bars... Pareto</td> | ||
| − | <td> | + | <td>these are <strong>different layouts</strong> that can be chosen for the chart.</td> |
</tr> | </tr> | ||
<tr> | <tr> | ||
<td><img style="display: block; margin-left: auto; margin-right: auto;" src="/images/2D3D.png" alt="" width="59" height="28" /></td> | <td><img style="display: block; margin-left: auto; margin-right: auto;" src="/images/2D3D.png" alt="" width="59" height="28" /></td> | ||
| − | <td> | + | <td>by clicking on these buttons, the chart will have a <strong>2D/3D layout.</strong></td> |
</tr> | </tr> | ||
<tr> | <tr> | ||
<td style="text-align: center;"><img src="/images/0,00.png" alt="" /><br /></td> | <td style="text-align: center;"><img src="/images/0,00.png" alt="" /><br /></td> | ||
| − | <td> | + | <td>this button sets the <strong>decimal places.</strong></td> |
</tr> | </tr> | ||
<tr> | <tr> | ||
<td style="text-align: center;"><img src="/images/BE.png" alt="" width="43" height="27" /></td> | <td style="text-align: center;"><img src="/images/BE.png" alt="" width="43" height="27" /></td> | ||
| − | <td> | + | <td>displays <strong>basis unit</strong> or <strong>unit</strong>.<br /></td> |
</tr> | </tr> | ||
<tr> | <tr> | ||
<td style="text-align: center;"><img src="/images/Colours.png" alt="" width="59" height="25" /><br /></td> | <td style="text-align: center;"><img src="/images/Colours.png" alt="" width="59" height="25" /><br /></td> | ||
| − | <td> | + | <td>changes <strong>background colours</strong> of the graph and of the form. A third option allows the <strong>swapping the colours</strong> between the graph and the form.</td> |
</tr> | </tr> | ||
<tr> | <tr> | ||
<td><img style="display: block; margin-left: auto; margin-right: auto;" src="/images/Legend.png" alt="" width="57" height="25" /></td> | <td><img style="display: block; margin-left: auto; margin-right: auto;" src="/images/Legend.png" alt="" width="57" height="25" /></td> | ||
| − | <td> | + | <td>click on this button to <strong>show/hide the legend.</strong></td> |
</tr> | </tr> | ||
<tr> | <tr> | ||
<td><img style="display: block; margin-left: auto; margin-right: auto;" src="/images/Toolbar.png" alt="" width="59" height="27" /></td> | <td><img style="display: block; margin-left: auto; margin-right: auto;" src="/images/Toolbar.png" alt="" width="59" height="27" /></td> | ||
| − | <td> | + | <td>click on this button to <strong>show/hide the toolbar.</strong></td> |
</tr> | </tr> | ||
<tr> | <tr> | ||
<td><img style="display: block; margin-left: auto; margin-right: auto;" src="/images/PlusChart.png" alt="" width="54" height="29" /></td> | <td><img style="display: block; margin-left: auto; margin-right: auto;" src="/images/PlusChart.png" alt="" width="54" height="29" /></td> | ||
| − | <td> | + | <td>creates a new chart. It will be opened at the right side of the window. Close it with the red <strong>X</strong> button.</td> |
| − | </ | + | |
| − | + | ||
| − | + | ||
| − | + | ||
| − | + | ||
| − | + | ||
| − | + | ||
| − | + | ||
</tr> | </tr> | ||
<tr> | <tr> | ||
<td style="text-align: center;"><img src="/images/Ed.png" alt="" /></td> | <td style="text-align: center;"><img src="/images/Ed.png" alt="" /></td> | ||
| − | <td> | + | <td>click on this button to edit the<strong> chart title.</strong></td> |
</tr> | </tr> | ||
<tr> | <tr> | ||
<td style="text-align: center;"><img src="/images/ed1.png" alt="" width="24" height="22" /></td> | <td style="text-align: center;"><img src="/images/ed1.png" alt="" width="24" height="22" /></td> | ||
| − | <td> | + | <td>click on this button to edit the <strong>font</strong> and<strong> colour </strong>of titles and legend.</td> |
</tr> | </tr> | ||
<tr> | <tr> | ||
<td style="text-align: center;"><img src="/images/ed2.png" alt="" width="24" height="22" /></td> | <td style="text-align: center;"><img src="/images/ed2.png" alt="" width="24" height="22" /></td> | ||
| − | <td> | + | <td>click on this icon to <strong>hide/show pattern bar</strong>, <strong>palette bar and legend</strong>. By clicking on this button it is also possible to <strong>access to the data editor.</strong></td> |
</tr> | </tr> | ||
<tr> | <tr> | ||
<td style="text-align: center;"><img src="/images/ed3.png" alt="" width="24" height="22" /></td> | <td style="text-align: center;"><img src="/images/ed3.png" alt="" width="24" height="22" /></td> | ||
| − | <td> | + | <td>click on this button to <strong>modify the view options.</strong></td> |
| + | </tr> | ||
| + | <tr> | ||
| + | <td style="text-align: center;">Parameter</td> | ||
| + | <td>changes the <strong>Parameters</strong> shown in the chart.</td> | ||
| + | </tr> | ||
| + | <tr> | ||
| + | <td style="text-align: center;">Time period</td> | ||
| + | <td>sets a time period.</td> | ||
</tr> | </tr> | ||
<tr> | <tr> | ||
<td><img style="display: block; margin-left: auto; margin-right: auto;" src="/images/Graph.png" alt="" width="85" height="26" /></td> | <td><img style="display: block; margin-left: auto; margin-right: auto;" src="/images/Graph.png" alt="" width="85" height="26" /></td> | ||
<td> | <td> | ||
| − | <p><strong> | + | <p><strong>by clicking this button the user can:</strong></p> |
<ul> | <ul> | ||
| − | <li>choose to print the chart | + | <li>choose to print the chart; </li> |
| − | <li> | + | <li>send the data or the chart to the clipboard;</li> |
| − | <li> | + | <li>export the chart as .chf, .xls or .csv file;</li> |
| − | <li> | + | <li>import the chart from .chf files;</li> |
| − | <li> | + | <li>exchange chart type.</li> |
</ul> | </ul> | ||
| + | </td> | ||
| + | </tr> | ||
| + | </tbody> | ||
| + | </table> | ||
| + | <p> </p> | ||
| + | <table style="margin-left: auto; margin-right: auto;" border="0" width="457" height="92"> | ||
| + | <tbody> | ||
| + | <tr> | ||
| + | <td><img src="/images/hint48.png" alt="" width="48" height="48" /></td> | ||
| + | <td> | ||
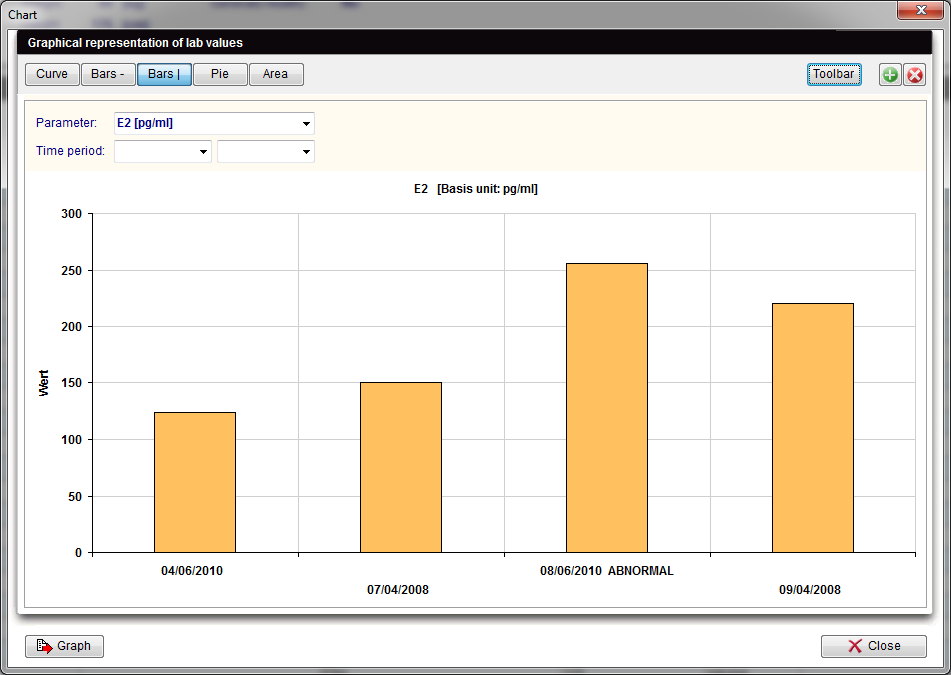
| + | <p>If your system does not give support to the necessary library, a much simpler version of this tool will be presented.</p> | ||
| + | <p>It is also possible to switch between modes clicking on the button <strong>Graph </strong>and choosing <strong>Exchange chart type</strong>.</p> | ||
| + | </td> | ||
| + | </tr> | ||
| + | <tr> | ||
| + | <td colspan="2"> | ||
| + | <p>[[Image:ChartCVG.png|none|740px|thumb|left|link=http://wiki.meditex-software.com/images/ChartCVG.png| ]]</p> | ||
</td> | </td> | ||
</tr> | </tr> | ||
| Line 104: | Line 121: | ||
</tbody> | </tbody> | ||
</table> | </table> | ||
| − | |||
Latest revision as of 08:24, 13 February 2013
| <img src="/images/Statistics.png" alt="" width="60" height="38" /> | If the Statistics button is clicked the following window will pop up: |
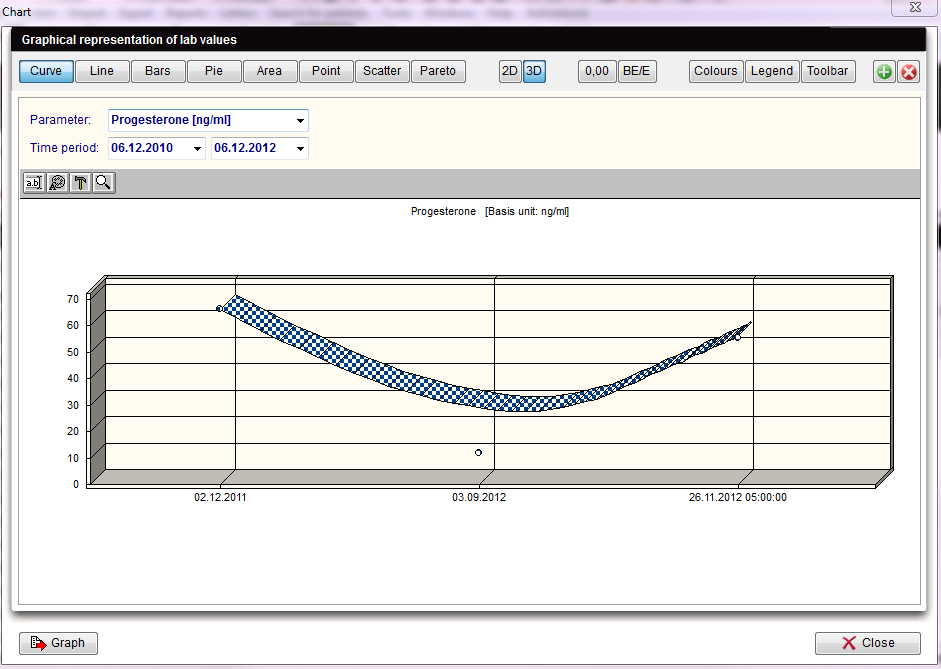 |
For the x-axis of your statistics you can use all columns of the list of results.
For the y-axis you can only use column whose associated field from the data base contains numerical values only (integers, floating-point numbers).
These are only descriptive statistics: histograms, plots and their individual parts.
The interpretation of the y-values exclusively depends on the scale measurement of the data used (the data is, however, displayed in such a way as if the values were all interval-scaled).
| Explanation of the fields/icons: | |
| Curve, Bars... Pareto | these are different layouts that can be chosen for the chart. |
| <img style="display: block; margin-left: auto; margin-right: auto;" src="/images/2D3D.png" alt="" width="59" height="28" /> | by clicking on these buttons, the chart will have a 2D/3D layout. |
| <img src="/images/0,00.png" alt="" /> |
this button sets the decimal places. |
| <img src="/images/BE.png" alt="" width="43" height="27" /> | displays basis unit or unit. |
| <img src="/images/Colours.png" alt="" width="59" height="25" /> |
changes background colours of the graph and of the form. A third option allows the swapping the colours between the graph and the form. |
| <img style="display: block; margin-left: auto; margin-right: auto;" src="/images/Legend.png" alt="" width="57" height="25" /> | click on this button to show/hide the legend. |
| <img style="display: block; margin-left: auto; margin-right: auto;" src="/images/Toolbar.png" alt="" width="59" height="27" /> | click on this button to show/hide the toolbar. |
| <img style="display: block; margin-left: auto; margin-right: auto;" src="/images/PlusChart.png" alt="" width="54" height="29" /> | creates a new chart. It will be opened at the right side of the window. Close it with the red X button. |
| <img src="/images/Ed.png" alt="" /> | click on this button to edit the chart title. |
| <img src="/images/ed1.png" alt="" width="24" height="22" /> | click on this button to edit the font and colour of titles and legend. |
| <img src="/images/ed2.png" alt="" width="24" height="22" /> | click on this icon to hide/show pattern bar, palette bar and legend. By clicking on this button it is also possible to access to the data editor. |
| <img src="/images/ed3.png" alt="" width="24" height="22" /> | click on this button to modify the view options. |
| Parameter | changes the Parameters shown in the chart. |
| Time period | sets a time period. |
| <img style="display: block; margin-left: auto; margin-right: auto;" src="/images/Graph.png" alt="" width="85" height="26" /> |
by clicking this button the user can:
|
| <img src="/images/hint48.png" alt="" width="48" height="48" /> |
If your system does not give support to the necessary library, a much simpler version of this tool will be presented. It is also possible to switch between modes clicking on the button Graph and choosing Exchange chart type. |
 |
|
| <a href="/index.php?title=MedITEX_IVF_manual">Back to the MedITEX IVF menu </a> | <a href="#top">Back to top</a> |